
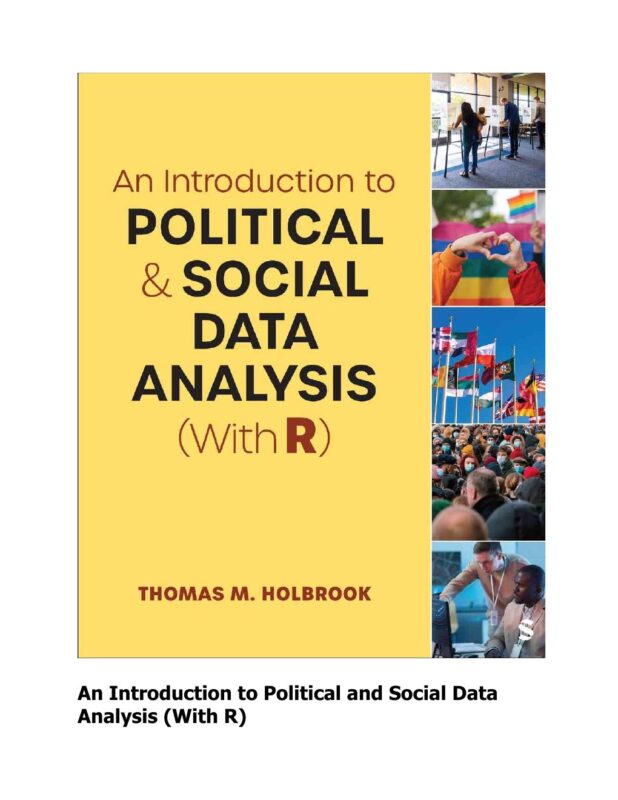
An Introduction to Political and Social Data Analysis (With R) 1st Edition By Thomas Holbrook
$30.00
Secure checkout
Instant digital download
PDF document
Document details
- Pages
- 526
- File size
- 24.73 MB
- Format
- Digital PDF
- Course
- Social Sciences
- Category
- eBook[PDF]
Sign in or create a free account to continue. Your purchase will be saved in My Downloads.
About this ebook
An Introduction to Political and Social Data Analysis (With R), 1st Edition by Thomas M. Holbrook focuses on teaching practical data analysis to social science students by prioritizing statistical concepts before introducing basic R code. Published by SAGE Publications, the book is structured around an applied, "learning-by-doing" approach that uses real-world social and political science datasets. [1]
The primary concepts and thematic areas covered throughout the text include:
Core Topics & Concepts Covered
- Introduction to the R Environment: A gentle, beginner-friendly introduction to using R syntax, working with RStudio, and managing data files without overcomplicating commands. [1]
- Research Design & Data Processing: Formulating hypotheses, understanding variables (independent vs. dependent), and identifying different types of data measurement levels (nominal, ordinal, interval/ratio).
- Descriptive Statistics: Summarizing and describing social data using measures of central tendency (mean, median, mode) and measures of dispersion (variance, standard deviation).
- Data Visualization: Constructing visual displays of data (such as histograms, bar charts, and scatterplots) to reveal patterns in public opinion, voting behavior, and demographics. [1]
- Bivariate Analysis: Testing foundational relationships between two variables using basic statistical tools like cross-tabulations, chi-square tests, and t-tests.
- Correlation and Linear Regression: Measuring the strength and direction of linear relationships and interpreting how one social factor predicts another.
- Statistical Inference & Hypothesis Testing: Distinguishing between aggregate and individual-level data, understanding causal logic, and testing whether findings are statistically significant.
Pedagogical Features Included
To reinforce these topics, every chapter features dedicated sections to build hands-on skills: [1]
- Code Chunks: Copy-and-paste code snippets embedded alongside figures and tables so students can replicate results immediately.
- Conceptual & Calculation Exercises: End-of-chapter questions designed to test both theoretical understanding and quantitative logic.
- Contemporary Datasets: Analysis based on real-world political science and global sociological surveys. [1, 2]
File included
tmpphpzmhP1r
24.73 MB
Related ebooks