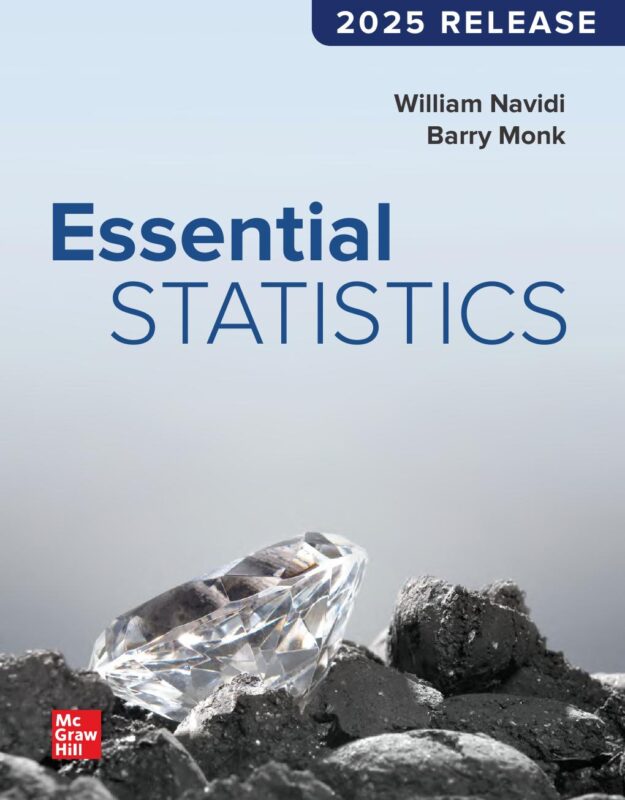
Essential Statistics 2025 Release By William Navidi
$30.00
Secure checkout
Instant digital download
PDF document
Document details
- Pages
- 734
- File size
- 24.96 MB
- Format
- Digital PDF
- Course
- Business Statistics
- Category
- eBook[PDF]
Sign in or create a free account to continue. Your purchase will be saved in My Downloads.
About this ebook
The Essential Statistics: 2025 Release textbook by William Navidi and Barry Monk, published by McGraw Hill, covers 11 foundational chapters structured for a comprehensive, algebra-based introductory course.
🗒 Detailed Table of Contents
- Chapter 1: Basic Ideas: Introduction to data structure, sampling methodologies, types of variables, experimental design principles, and identifying systematic bias in studies.
- Chapter 2: Graphical Summaries of Data: Construction and interpretation of frequency distributions, bar graphs, pie charts, histograms, stem-and-leaf plots, and evaluating misleading graphics.
- Chapter 3: Numerical Summaries of Data: Calculation of central tendency metrics (mean, median, mode), measures of dispersion/spread (variance, standard deviation, range), and position metrics like percentiles, quartiles, and z-scores.
- Chapter 4: Probability: Fundamental probability rules, addition rule, rule of complements, conditional probability, multiplication rule, and independent events.
- Chapter 5: Discrete Probability Distributions: Random variables, probability mass functions, expected value, variance of discrete random variables, and the binomial distribution.
- Chapter 6: The Normal Distribution: Continuous probability density functions, standard normal distribution calculations, applications of the normal curve, and the Central Limit Theorem.
- Chapter 7: Confidence Intervals: Constructing point estimates and interval estimations for single population means and single population proportions.
- Chapter 8: Hypothesis Testing: Forming null and alternative hypotheses, calculating p-values, critical values, and conducting significance tests for a single mean or proportion.
- Chapter 9: Inferences on Two Samples: Confidence intervals and hypothesis testing comparing two independent population means, paired/dependent samples, and two population proportions.
- Chapter 10: Tests with Qualitative Data: Chi-Square goodness-of-fit tests, tests for independence, and tests for homogeneity in contingency tables.
- Chapter 11: Correlation and Regression: Exploring bivariate relationships, calculating the linear correlation coefficient (r), determining the least-squares regression line equation, and interpreting residual plots. [1, 2, 3, 4, 5, 6]
💡 Core Educational Themes & Tool Integrations
The textbook delivers these topics through three central instructional pillars designed for postsecondary learners: [1, 2]
- Clarity and Accessibility: Complex mathematical theory is broken down using straightforward explanations requiring only a fundamental prerequisite in basic algebra. [1]
- Real-World Application: Problem sets leverage actual data collections alongside robust exercise sets that span basic skill practice to complex conceptual analysis. [1]
- Technology Step-by-Steps: Includes detailed walkthrough structures for executing statistical operations using TI-84 Plus Graphing Calculators (including Stat Wizards), Microsoft Excel, and Minitab. [1, 2]
File included
tmpphpzybGm7
24.96 MB
Related ebooks